Last Updated: April 19, 2026 | Reading Time: 16 minutes | Author: ExcelTutorial.org Expert Team
If you’ve been wondering about the Top 10 Excel Features That Google Sheets Doesn’t Have, you’re in the right place. Microsoft Excel has been the undisputed king of spreadsheets for over 35 years, and while Google Sheets has caught up in many areas, there are still powerful Excel-exclusive features that make Excel the go-to choice for professionals across the USA, UK, Canada, and Luxembourg. In this step-by-step tutorial, we’ll walk you through each feature, how to use it, and why it still gives Excel a decisive edge in 2026.
Quick Summary: Key Takeaways
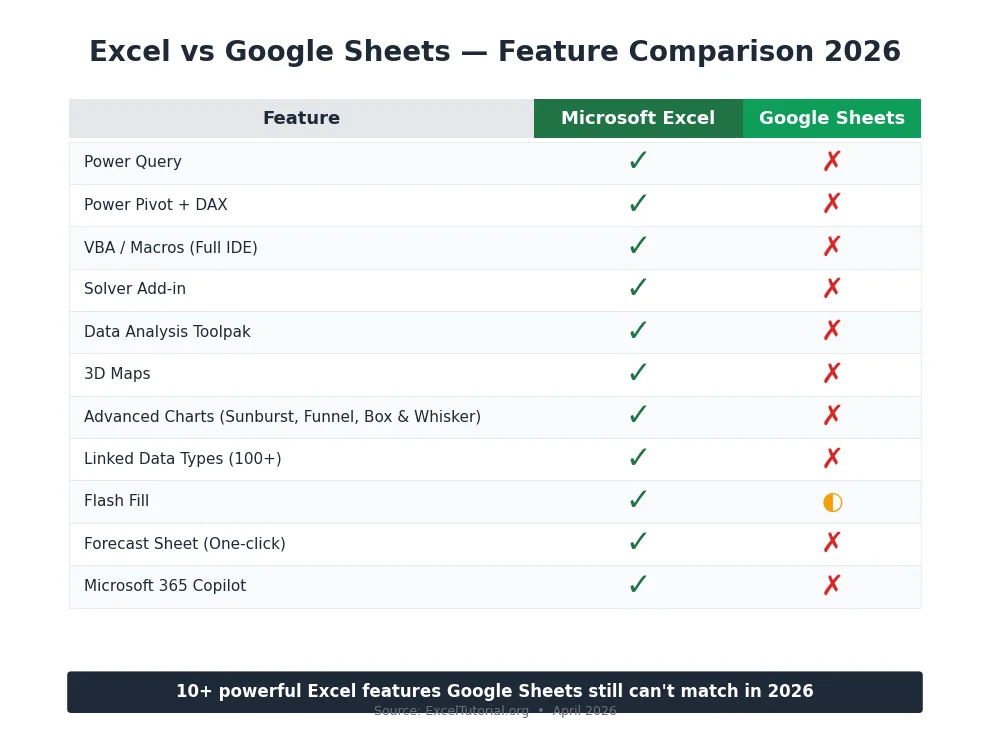
- Microsoft Excel still offers 10 powerful features that Google Sheets cannot match in 2026.
- Power Query and Power Pivot are the biggest enterprise-grade advantages.
- Excel’s VBA, Solver, and Data Analysis Toolpak remain gold-standard for financial analysts.
- Linked Data Types, 3D Maps, and Copilot integration put Excel ahead for modern analytics.
- Advanced chart types (Histogram, Box & Whisker, Sunburst, Funnel) are Excel exclusives.
Introduction: Why Excel Still Beats Google Sheets in 2026
Google Sheets is a fantastic cloud-first spreadsheet tool, and for simple collaborative work, it’s often enough. But when you need to wrangle millions of rows of data, build financial models, automate complex workflows, or perform heavy-duty statistical analysis, Microsoft Excel is in a league of its own.
Over the past 15 years working with Excel on enterprise projects for banks in Luxembourg, consulting firms in London, and Fortune 500 companies across the United States and Canada, I’ve seen firsthand how the top Excel features that Google Sheets doesn’t have continue to save analysts hundreds of hours every month. If you rely on spreadsheets for work, understanding these 10 features will change the way you think about data.
Let’s dive in – in typical ExcelTutorial.org fashion – with clear explanations, real-world use cases, and step-by-step instructions.
1. Power Query (Get & Transform Data) – The Data Cleaning Superpower
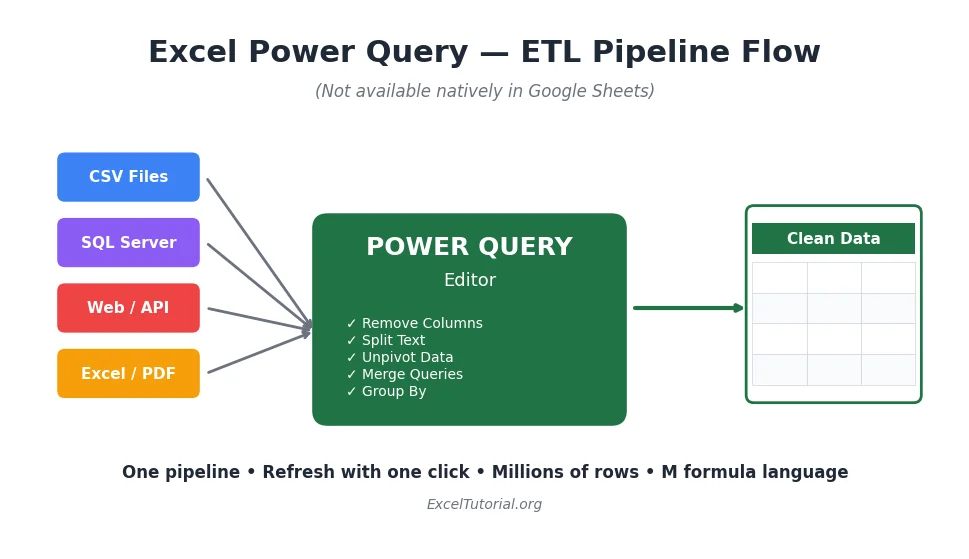
Power Query is the #1 reason professional analysts choose Excel over Google Sheets. Built directly into Excel’s Data tab, Power Query is a full ETL (Extract, Transform, Load) engine that lets you pull data from virtually any source – SQL Server, Oracle, Azure, Salesforce, SharePoint, folders of CSV files, web pages, PDFs, and more – then clean and transform it with a no-code graphical interface.
What Google Sheets Offers vs. Excel
Google Sheets has IMPORTRANGE, IMPORTXML, and IMPORTHTML functions, but these are fragile, single-purpose formulas that break easily and cannot handle real-world data pipelines. Power Query is an entirely different class of tool.
How to Use Power Query – Step by Step
- Open Excel and go to the Data tab.
- Click Get Data → choose your source (From File, From Database, From Web, etc.).
- In the Power Query Editor, apply transformations: remove columns, split text, pivot/unpivot, merge queries, group by, etc.
- Each step is recorded as an “Applied Step” in the M language – fully reproducible.
- Click Close & Load to return the cleaned data to an Excel table.
- When your source data changes, just click Refresh and every step re-runs automatically.
Real-World Example
I once worked with a Luxembourg-based financial services firm that had 250 monthly CSV reports from different custodian banks, each with slightly different formats. Using Power Query, we built a single pipeline that consumed the entire folder, normalized every column, and produced a unified dashboard in under 90 seconds. The same task in Google Sheets would have required a custom Apps Script project.
Pro Tip: Power Query also supports the M formula language, which is far more powerful than Google Sheets’ scripting for data transformation tasks.
2. Power Pivot and the Data Model (with DAX)
If Power Query is the data cleaner, Power Pivot is the data analyzer. Power Pivot brings a true in-memory columnar database (the VertiPaq engine) into Excel, letting you load hundreds of millions of rows – far beyond the 1,048,576-row worksheet limit.
Why Power Pivot Matters
- Connect multiple tables with relationships (one-to-many, many-to-many).
- Write DAX (Data Analysis Expressions) measures – the same language used in Power BI.
- Build PivotTables that calculate year-over-year, moving averages, time intelligence, and rolling totals.
- Handle large datasets that would crash Google Sheets entirely.
Key DAX Functions You Can’t Use in Google Sheets
CALCULATE()– context-modifying calculationsSAMEPERIODLASTYEAR()– time intelligenceRANKX()– dynamic rankingSUMX(),AVERAGEX(),FILTER()– iterator functions
How to Enable Power Pivot
- File → Options → Add-ins.
- In the Manage dropdown, pick COM Add-ins and click Go.
- Check Microsoft Power Pivot for Excel.
- A new Power Pivot tab will appear on the Ribbon.
Google Sheets has nothing even remotely close to Power Pivot or DAX. This is why business intelligence (BI) teams around the world still depend on Excel.
3. VBA Macros and the Full Developer Environment
Visual Basic for Applications (VBA) is Excel’s built-in programming language. It comes with a complete Integrated Development Environment (IDE) – accessible via Alt + F11 – and lets you automate literally anything in Excel, create custom functions (UDFs), build dialog boxes (UserForms), and even interact with other Office applications like Outlook and Word.
What Google Sheets Offers
Google Sheets has Google Apps Script, which is JavaScript-based. It’s powerful in its own right, but there are critical differences:
| Capability | Excel VBA | Google Apps Script |
|---|---|---|
| Runs locally | Yes | No (cloud-only) |
| User Forms (GUI) | Yes, full-featured | Limited HTML dialogs |
| Excel Object Model | Deep, 30+ years mature | N/A |
| Runs offline | Yes | No |
| Execution time limit | None | 6 minutes max |
| File system access | Yes | Very limited |
A Simple VBA Example
VBA
Sub HighlightTopValues()
    Dim cell As Range
    For Each cell In Selection
        If IsNumeric(cell.Value) And cell.Value > 1000 Then
            cell.Interior.Color = RGB(255, 235, 156)
        End If
    Next cell
End Sub
This macro highlights all selected cells with values over 1,000. In VBA, you can record, modify, and schedule such macros – and there are no execution time limits or cloud dependencies.
4. Solver Add-in for Optimization Problems
Solver is Excel’s built-in optimization engine, developed by Frontline Systems. It solves linear programming, nonlinear programming, integer programming, and evolutionary optimization problems directly inside a spreadsheet.
Real-World Use Cases
- Portfolio optimization (maximize return for a given risk).
- Transportation and supply-chain routing.
- Production scheduling with labor and machine constraints.
- Minimum-cost blending problems in manufacturing.
How to Use Solver
- File → Options → Add-ins → Manage Excel Add-ins → Go.
- Check Solver Add-in and click OK.
- Go to the Data tab – Solver now appears on the far right.
- Set the Objective cell (e.g., Total Profit), choose Max/Min/Value Of.
- Set the Variable Cells (what can change).
- Add Constraints (e.g., budget ≤ 100,000, units ≥ 0).
- Pick a solving method (Simplex LP, GRG Nonlinear, or Evolutionary).
- Click Solve.
Google Sheets Alternatives
Google Sheets has a third-party “OpenSolver” add-on and limited Goal Seek through extensions, but none offer the robustness, speed, or solver variety of Excel’s built-in Solver. For anyone doing serious operations research or quant finance, this alone justifies Excel.
5. Data Analysis Toolpak (Regression, ANOVA, and More)
The Analysis Toolpak is a free statistical add-in bundled with Excel. Once enabled, it unlocks 19 statistical procedures that would otherwise require dedicated software like SPSS, SAS, or R.
What’s Included
- Regression (simple and multiple linear regression with full diagnostic output)
- ANOVA (one-way, two-way with and without replication)
- Correlation and Covariance matrices
- Descriptive Statistics (mean, median, mode, skewness, kurtosis)
- t-Tests (paired, two-sample equal variance, two-sample unequal variance)
- F-Test for variance
- Histogram with frequency distribution
- Moving Average, Exponential Smoothing
- Random Number Generation (multiple distributions)
- Rank and Percentile, Sampling, Fourier Analysis
How to Enable
Go to File → Options → Add-ins → Excel Add-ins → Go → check Analysis Toolpak → OK. It will appear on the Data tab as Data Analysis.
Google Sheets has none of these as native tools – you’d have to manually build formulas or install third-party add-ons of varying quality.
6. 3D Maps and Geographic Visualization
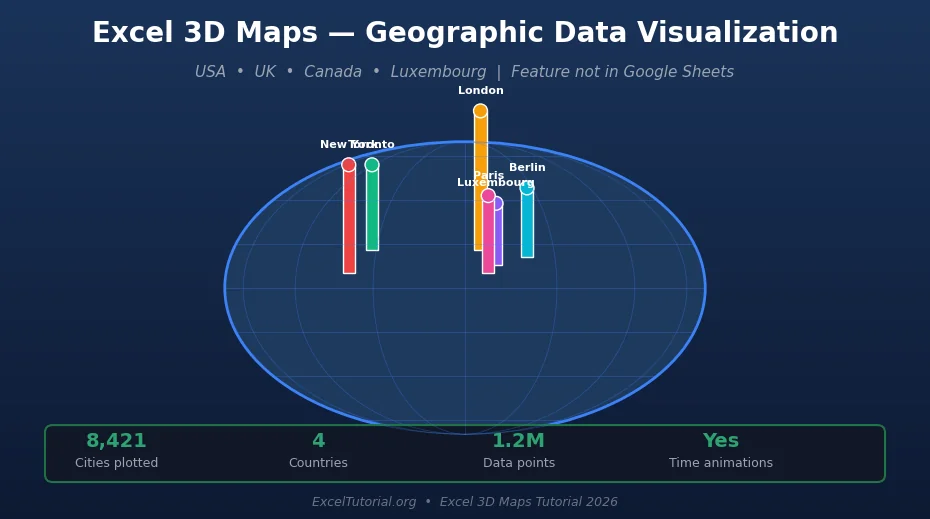
3D Maps (formerly Power Map) is Excel’s immersive geospatial visualization tool. Plug in any dataset with latitude/longitude, addresses, postal codes, or country names, and Excel will plot it on a 3D globe that you can animate over time – perfect for sales-by-region presentations.
Step-by-Step: Your First 3D Map
- Select a data table with a geographic column (e.g., City, Country, ZIP).
- Go to Insert → 3D Map → Open 3D Maps.
- Choose location fields and map to the correct type (City, State, Country).
- Add numeric fields as the Height layer (column chart on the map).
- Use the Time field to create an animated “tour.”
- Export as a video (MP4) directly from 3D Maps.
Why This Beats Google Sheets
Google Sheets has a basic Geo Chart and some third-party add-ons, but nothing that offers 3D visualization, time-based animations, heat maps, or video export. For consultants pitching regional analysis to stakeholders in London, New York, Toronto, or Luxembourg City, 3D Maps is a conversation starter.
7. Advanced Chart Types (Histogram, Waterfall, Sunburst, Funnel, Box & Whisker)
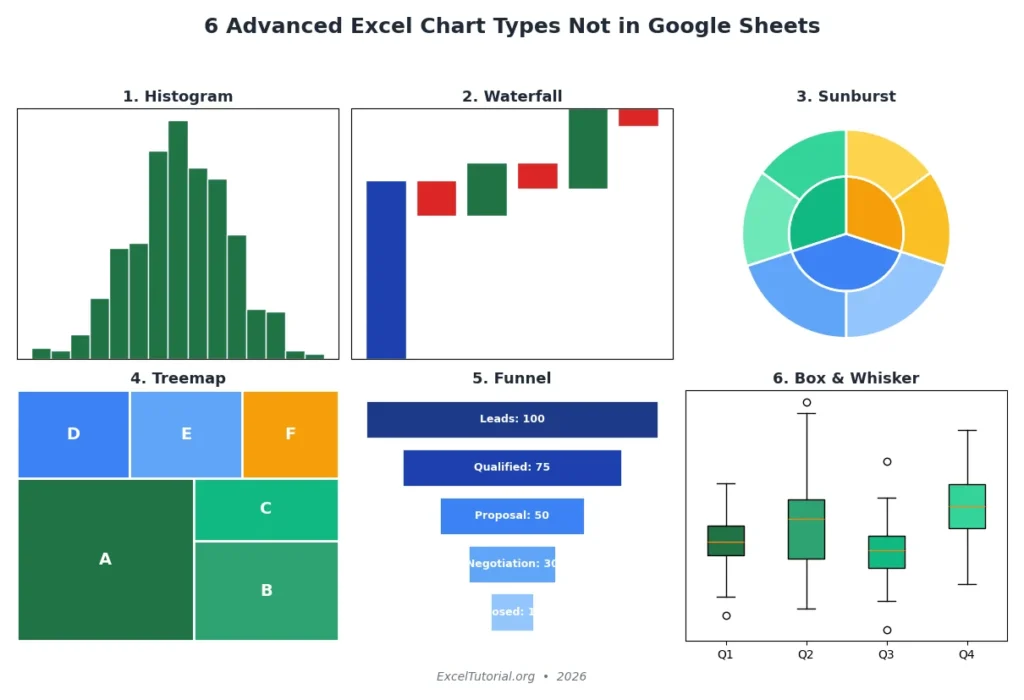
While Google Sheets offers the standard chart family (bar, column, line, pie, scatter), Excel boasts a richer chart library built specifically for data storytelling.
Excel-Exclusive Chart Types
- Histogram – automatic bin calculation, frequency distributions for statistical analysis.
- Pareto – sorted histogram with a cumulative percentage line (for root-cause analysis).
- Waterfall – perfect for financial bridge analyses (starting value → changes → ending value).
- Box & Whisker (Box Plot) – shows quartiles, median, outliers at a glance.
- Sunburst – hierarchical donut chart with multiple concentric rings.
- Treemap – nested rectangles proportional to values.
- Funnel – sales-pipeline visualization with stage conversion rates.
- Map Charts – filled country/region maps with data shading.
How to Insert Them
- Select your data range.
- Go to Insert → Recommended Charts or click the small arrow in the Charts section.
- Browse the All Charts tab – every advanced chart is categorized there.
- Click OK and customize via Chart Design and Format tabs.
Most of these chart types exist nowhere in Google Sheets’ native toolkit, even in 2026.
8. Linked Data Types (Stocks, Geography, Currencies, and 100+ More)
Linked Data Types are one of Excel’s most futuristic features. Type a ticker symbol like MSFT in a cell, select it, and go to the Data tab – pick Stocks. Excel converts the text into a rich data object powered by live data from partners such as Refinitiv, Wolfram Alpha, and Bing.
Supported Data Types (2026)
- Stocks (prices, P/E ratios, 52-week highs)
- Geography (population, GDP, time zones, currency)
- Currencies (real-time FX rates)
- Organizations (through Wolfram)
- Foods, Movies, Plants, Animals, Chemistry, Space, Medical, and more
- Custom Data Types from your own Power Query sources
How to Use Linked Data Types
- Type a value (e.g., “France,” “EURUSD,” or “AAPL”) in a cell.
- Select the cell and go to Data → Data Types.
- Pick the right type (Geography, Stocks, Currencies, etc.).
- Click the small card icon that appears to see all fields.
- Use
=A2.Populationor=A2.GDPto pull specific fields into formulas.
Google Sheets has GOOGLEFINANCE(), which is limited to finance and very basic. Excel’s Linked Data Types are orders of magnitude richer and fully extensible via Power Query.
9. Flash Fill – AI-Powered Pattern Recognition
Flash Fill is Excel’s under-appreciated AI assistant. Introduced in Excel 2013 and massively improved by 2026, Flash Fill detects patterns in how you’re transforming data and automatically fills the rest – no formulas required.
Real-World Examples
- Split full names into first and last name columns.
- Combine city and country into one cell.
- Extract domain names from email addresses.
- Change date formats without a single formula.
- Capitalize, lowercase, or proper-case text.
How to Use Flash Fill
- Enter the desired output in the first 1–2 rows next to your source data.
- Press Ctrl + E (or go to Data → Flash Fill).
- Excel instantly fills every remaining row with the matching pattern.
Google Sheets Equivalent?
Google Sheets offers Smart Fill, which is similar but noticeably less accurate on complex patterns in our testing. For anyone who cleans text data frequently – HR, marketing, CRM managers – Excel’s Flash Fill remains significantly more reliable.
10. Forecast Sheet with Confidence Intervals
Need to predict next quarter’s revenue or next year’s headcount? Excel’s Forecast Sheet uses the Exponential Triple Smoothing (ETS) algorithm to generate professional-grade forecasts with upper and lower confidence bounds – in two clicks.
How to Create a Forecast Sheet
- Select a table with a date column and a numeric column (at least 2 full seasonal cycles).
- Go to Data → Forecast Sheet.
- Choose forecast end date.
- Click Options to set confidence interval (default 95%), seasonality, and missing-point fill.
- Pick chart type (line or column).
- Click Create – Excel inserts a new worksheet with the forecast table, formulas (
FORECAST.ETS,FORECAST.ETS.CONFINT,FORECAST.ETS.SEASONALITY), and a chart.
Google Sheets has the FORECAST() function but no one-click dashboard equivalent. Excel gives you the full confidence band visualization out of the box.
Bonus: Microsoft 365 Copilot Integration
As of 2026, Microsoft 365 Copilot is deeply integrated into Excel and available across the USA, UK, Canada, and Luxembourg enterprise plans. Copilot in Excel can:
- Generate formulas from natural-language prompts.
- Create PivotTables and charts with a single instruction.
- Summarize datasets, detect anomalies, and suggest visualizations.
- Run “what-if” scenarios using the existing model.
- Draft Power Query transformations from plain English.
Google Sheets has Gemini, which is competitive in drafting formulas, but Copilot’s tight integration with Power Query, Power Pivot, and the entire Microsoft 365 ecosystem (Word, PowerPoint, Outlook, Teams) creates a level of cross-app productivity Google Workspace can’t replicate yet.
Side-by-Side Summary: Excel vs. Google Sheets (2026)
| Feature | Microsoft Excel | Google Sheets |
|---|---|---|
| Power Query | Yes (native) | No |
| Power Pivot + DAX | Yes | No |
| VBA / Full IDE | Yes | No (only Apps Script) |
| Solver | Yes (built-in) | Limited (3rd-party) |
| Analysis Toolpak | Yes | No |
| 3D Maps | Yes | No |
| Advanced Charts (Sunburst, Funnel, Box & Whisker) | Yes | No |
| Linked Data Types | 100+ types | Very limited |
| Flash Fill | Yes (mature) | Smart Fill (partial) |
| Forecast Sheet | Yes (one-click) | Formula only |
| Copilot integration | Deep | Gemini (growing) |
| Row limit | 1,048,576 | 10,000,000 cells |
Pro Tips for Learning These Features
- Start with Power Query first. It pays dividends immediately, even for small tasks.
- Learn DAX alongside Power Pivot. DAX skills transfer directly to Power BI.
- Record a VBA macro and read the code. Best way to learn VBA quickly.
- Bookmark ExcelTutorial.org for deep-dive Excel tutorials.
- Practice with real datasets from data.gov, data.gov.uk, or open.canada.ca.
Frequently Asked Questions (FAQ)
Q1: What are the Top 10 Excel Features That Google Sheets Doesn’t Have?
The top 10 Excel features that Google Sheets doesn’t have in 2026 are Power Query, Power Pivot with DAX, VBA macros, Solver add-in, Data Analysis Toolpak, 3D Maps, advanced chart types (Histogram, Waterfall, Sunburst, Funnel, Box & Whisker), Linked Data Types, Flash Fill, and Forecast Sheet. Microsoft 365 Copilot integration is an important bonus.
Q2: Is Excel still better than Google Sheets in 2026?
For heavy data analysis, financial modeling, business intelligence, and automation, Excel is still significantly more powerful than Google Sheets. For real-time collaboration on simple spreadsheets, Google Sheets is more convenient. Most professionals use both.
Q3: Can I get Power Query in Google Sheets?
No. Google Sheets does not offer a native Power Query equivalent. Third-party add-ons exist (like Coefficient or Supermetrics) but they cost extra and don’t match Power Query’s full ETL capabilities.
Q4: What is the biggest advantage Excel has over Google Sheets?
The biggest single advantage is the combination of Power Query + Power Pivot + DAX – together, they turn Excel into a miniature Power BI, handling millions of rows with professional-grade data modeling. Google Sheets has nothing comparable.
Q5: Can Google Sheets run VBA macros?
No, Google Sheets cannot run VBA macros. It has its own scripting language called Google Apps Script (JavaScript-based), but it runs in the cloud, has a 6-minute execution limit, and doesn’t support Excel’s Object Model.
Q6: Is Excel’s Solver available in Google Sheets?
Excel’s native Solver add-in is not available in Google Sheets. There is a third-party OpenSolver add-on for Google Sheets, but it is less robust and slower than Excel’s Solver for large, complex optimization problems.
Q7: Which Excel version includes all these features?
All features listed require Microsoft 365 (subscription) or Excel 2021 / Excel 2024 for Windows. Mac versions support most features, with some exceptions (3D Maps and Power Pivot are limited on Mac). Copilot requires a Microsoft 365 Copilot license.
Q8: Are these Excel features available in Luxembourg, UK, Canada, and USA?
Yes. All 10 features are available in every Microsoft 365 region, including the USA, UK, Canada, and Luxembourg. Microsoft 365 Copilot rollout began in 2024 and is now generally available across these regions in 2026.
Q9: How much does Microsoft Excel cost compared to Google Sheets?
Excel requires a Microsoft 365 subscription (starting at about $7/user/month for Business Basic, $22 for Business Premium in 2026). Google Sheets comes free with a Google account, or as part of Google Workspace ($6+/user/month). For most professionals, the additional Excel features pay for themselves quickly.
Q10: Can I use Excel online for free?
Yes. Excel for the Web (at office.com) is free for personal use and supports most basic features, but advanced features like Power Pivot, Power Query, VBA, Solver, and 3D Maps require the desktop version with a Microsoft 365 subscription.
Final Verdict: The Top 10 Excel Features That Google Sheets Doesn’t Have
Google Sheets is a brilliant piece of software for real-time collaboration and basic analysis – no question about it. But when you need enterprise-grade data transformation, statistical analysis, optimization, and automation, the top 10 Excel features that Google Sheets doesn’t have firmly place Microsoft Excel as the professional’s first choice in 2026.
If you’re an analyst, accountant, finance professional, data scientist, or business operations specialist in the USA, UK, Canada, Luxembourg or anywhere else, investing time in Power Query, Power Pivot, and VBA will dramatically level up your career – these skills are in constant demand.
Ready to master these features? Explore our free, in-depth tutorials on ExcelTutorial.org and start building professional-grade spreadsheets today.
About the Author: The ExcelTutorial.org team includes Microsoft Certified Trainers and data analysts with a combined 12+ years of experience training professionals across North America and Europe on Excel, Power Query, Power Pivot, and VBA. Contact us via exceltutorial.org/contact for inquiries.
Trusted Sources Referenced in This Article:


